T001 · Compound data acquisition (ChEMBL)
Note: This talktorial is a part of TeachOpenCADD, a platform that aims to teach domain-specific skills and to provide pipeline templates as starting points for research projects.
Authors:
Svetlana Leng, CADD seminar 2017, Volkamer lab, Charité/FU Berlin
Paula Junge, CADD seminar 2018, Volkamer lab, Charité/FU Berlin
Dominique Sydow, 2019-2020, Volkamer lab, Charité
Andrea Volkamer, 2020, Volkamer lab, Charité
Yonghui Chen, 2020, Volkamer lab, Charité
Talktorial T001: This talktorial is part of the TeachOpenCADD pipeline described in the first TeachOpenCADD paper, comprising of talktorials T001-T010.
Aim of this talktorial
In this notebook, we will learn more about the ChEMBL database and how to extract data from ChEMBL, i.e. (compound, activity data) pairs for a target of interest. These data sets can be used for many cheminformatics tasks, such as similarity search, clustering or machine learning.
Our work here will include finding compounds that were tested against a certain target and filtering available bioactivity data.
Contents in Theory
ChEMBL database
ChEMBL web services
ChEMBL web resource client
Compound activity measures
IC50 measure
pIC50 value
Contents in Practical
Goal: Get a list of compounds with bioactivity data for a given target
Connect to ChEMBL database
Get target data (example: EGFR kinase)
Fetch and download target data
Select target ChEMBL ID
Get bioactivity data
Fetch and download bioactivity data for targets
Preprocess and filter bioactivity data
Get compound data
Fetch and download compound data
Preprocess and filter compound data
Output bioactivity-compound data
Merge bioactivity and compound data, and add pIC50 values
Draw molecules with highest pIC50
Freeze bioactivity data to ChEMBL 27
Write output file
References
ChEMBL bioactivity database: Gaulton et al., Nucleic Acids Res. (2017), 45(Database issue), D945–D954
ChEMBL web services: Davies et al., Nucleic Acids Res. (2015), 43, 612-620
GitHub ChEMBL web rescource client
The EBI RDF platform: Jupp et al., Bioinformatics (2014), 30(9), 1338-9
Info on half maximal inhibitory concentration: (p)IC50
[ ]:
import sys

if "google.colab" in sys.modules:
    %pip install teachopencadd --no-deps -q
    !teachopencadd -d 1
    %pip uninstall teachopencadd -y -q
    %pip install -qr requirements.txt
Theory
ChEMBL database
“ChEMBL is a manually curated database of bioactive molecules with drug-like properties. It brings together chemical, bioactivity and genomic data to aid the translation of genomic information into effective new drugs.” (ChEMBL website)
Open large-scale bioactivity database
Current data content (as of 09.2020, ChEMBL 27):
>1.9 million distinct compounds
>16 million activity values
Assays are mapped to ~13,000 targets
Data sources include scientific literature, PubChem bioassays, Drugs for Neglected Diseases Initiative (DNDi), BindingDB database, …
ChEMBL data can be accessed via a web-interface, the EBI-RDF platform and the ChEMBL web rescource client
ChEMBL web services
RESTful web service
ChEMBL web service version 2.x resource schema:
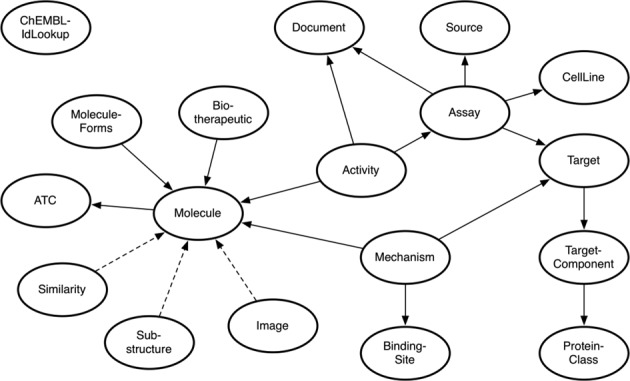
Figure 1: “ChEMBL web service schema diagram. The oval shapes represent ChEMBL web service resources and the line between two resources indicates that they share a common attribute. The arrow direction shows where the primary information about a resource type can be found. A dashed line indicates the relationship between two resources behaves differently. For example, the Image resource provides a graphical-based
representation of a Molecule.” Figure and description are taken from: Nucleic Acids Res. (2015), 43, 612-620.
ChEMBL web resource client
Python client library for accessing ChEMBL data
Handles interaction with the HTTPS protocol
Lazy evaluation of results -> reduced number of network requests
Compound activity measures
IC50 measure
Indicates how much of a particular drug or other substance is needed to inhibit a given biological process by half
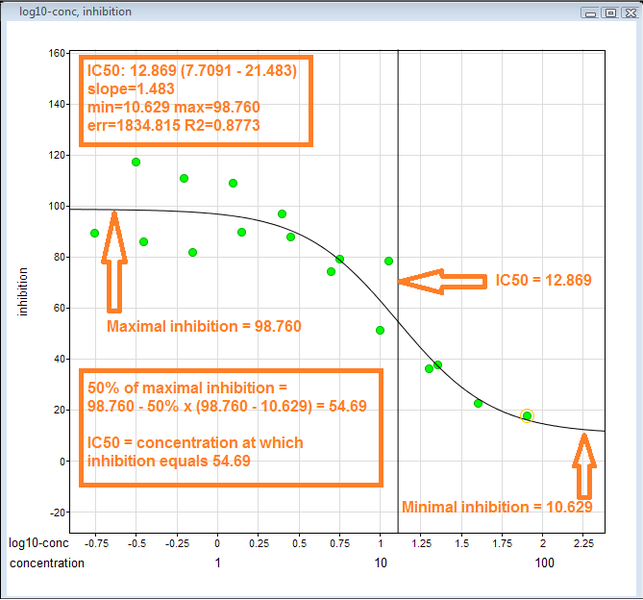
Figure 2: Visual demonstration of how to derive an IC50 value:
Arrange inhibition data on y-axis and log(concentration) on x-axis. (ii) Identify maximum and minimum inhibition. (iii) The IC50 is the concentration at which the curve passes through the 50% inhibition level. Figure “Example IC50 curve demonstrating visually how IC50 is derived” by JesseAlanGordon is licensed under CC BY-SA 3.0.
pIC50 value
To facilitate the comparison of IC50 values, which have a large value range and are given in different units (M, nM, …), often pIC50 values are used
The pIC50 is the negative log of the IC50 value when converted to molar units: $ pIC_{50} = -log_{10}(IC_{50}) $, where $ IC_{50}$ is specified in units of M
Higher pIC50 values indicate exponentially greater potency of the drug
Note that the conversion can be adapted to the respective IC50 unit, e.g. for nM: $pIC_{50} = -log_{10}(IC_{50}*10^{-9})= 9-log_{10}(IC_{50}) $
Other activity measures:
Besides, IC50 and pIC50, other bioactivity measures are used, such as the equilibrium constant KI and the half-maximal effective concentration EC50.
Practical
In the following, we want to download all molecules that have been tested against our target of interest, the epidermal growth factor receptor (EGFR) kinase.
Connect to ChEMBL database
First, the ChEMBL web resource client as well as other Python libraries are imported.
[2]:
import math
from pathlib import Path
from zipfile import ZipFile
from tempfile import TemporaryDirectory

import numpy as np
import pandas as pd
from rdkit.Chem import PandasTools
from chembl_webresource_client.new_client import new_client
from tqdm.auto import tqdm
/opt/miniconda3/envs/T001_3120/lib/python3.12/site-packages/tqdm/auto.py:21: TqdmWarning: IProgress not found. Please update jupyter and ipywidgets. See https://ipywidgets.readthedocs.io/en/stable/user_install.html
  from .autonotebook import tqdm as notebook_tqdm
[3]:
HERE = Path(_dh[-1])
DATA = HERE / "data"
Next, we create resource objects for API access.
[4]:
targets_api = new_client.target
compounds_api = new_client.molecule
bioactivities_api = new_client.activity
[5]:
type(targets_api)
[5]:
chembl_webresource_client.query_set.QuerySet
Get target data (EGFR kinase)
Get UniProt ID of the target of interest (EGFR kinase: P00533) from UniProt website
Use UniProt ID to get target information
Select a different UniProt ID, if you are interested in another target.
[6]:
uniprot_id = "P00533"
Fetch target data from ChEMBL
[7]:
# Get target information from ChEMBL but restrict it to specified values only
targets = targets_api.get(target_components__accession=uniprot_id).only(
    "target_chembl_id", "organism", "pref_name", "target_type"
)
print(f'The type of the targets is "{type(targets)}"')
The type of the targets is "<class 'chembl_webresource_client.query_set.QuerySet'>"
Download target data from ChEMBL
The results of the query are stored in targets, a QuerySet, i.e. the results are not fetched from ChEMBL until we ask for it (here using pandas.DataFrame.from_records).
More information about the QuerySet datatype:
QuerySets are lazy – the act of creating a QuerySet does not involve any database activity. You can stack filters together all day long, and Django will actually not run the query until the QuerySet is evaluated. (querysets-are-lazy)
[8]:
targets = pd.DataFrame.from_records(targets)
targets
[8]:
| organism | pref_name | target_chembl_id | target_type | |
|---|---|---|---|---|
| 0 | Homo sapiens | Epidermal growth factor receptor | CHEMBL203 | SINGLE PROTEIN |
| 1 | Homo sapiens | Epidermal growth factor receptor | CHEMBL203 | SINGLE PROTEIN |
| 2 | Homo sapiens | Epidermal growth factor receptor and ErbB2 (HE... | CHEMBL2111431 | PROTEIN FAMILY |
| 3 | Homo sapiens | Epidermal growth factor receptor | CHEMBL2363049 | PROTEIN FAMILY |
| 4 | Homo sapiens | MER intracellular domain/EGFR extracellular do... | CHEMBL3137284 | CHIMERIC PROTEIN |
| 5 | Homo sapiens | Protein cereblon/Epidermal growth factor receptor | CHEMBL4523680 | PROTEIN-PROTEIN INTERACTION |
| 6 | Homo sapiens | EGFR/PPP1CA | CHEMBL4523747 | PROTEIN-PROTEIN INTERACTION |
| 7 | Homo sapiens | von Hippel-Lindau disease tumor suppressor/EGFR | CHEMBL4523998 | PROTEIN-PROTEIN INTERACTION |
| 8 | Homo sapiens | Baculoviral IAP repeat-containing protein 2/Ep... | CHEMBL4802031 | PROTEIN-PROTEIN INTERACTION |
| 9 | Homo sapiens | CCN2-EGFR | CHEMBL5465557 | PROTEIN-PROTEIN INTERACTION |
| 10 | Homo sapiens | Microtubule-associated protein 1 light chain 3... | CHEMBL6066839 | PROTEIN-PROTEIN INTERACTION |
| 11 | Homo sapiens | Glucose-induced degradation protein 4 homolog/... | CHEMBL6066845 | PROTEIN-PROTEIN INTERACTION |
Select target (target ChEMBL ID)
After checking the entries, we select the first entry as our target of interest:
CHEMBL203: It is a single protein and represents the human Epidermal growth factor receptor (EGFR, also named erbB1)
[9]:
target = targets.iloc[0]
target
[9]:
organism                                Homo sapiens
pref_name           Epidermal growth factor receptor
target_chembl_id                           CHEMBL203
target_type                           SINGLE PROTEIN
Name: 0, dtype: object
Save selected ChEMBL ID.
[10]:
chembl_id = target.target_chembl_id
print(f"The target ChEMBL ID is {chembl_id}")
# NBVAL_CHECK_OUTPUT
The target ChEMBL ID is CHEMBL203
Get bioactivity data
Now, we want to query bioactivity data for the target of interest.
Fetch bioactivity data for the target from ChEMBL
In this step, we fetch the bioactivity data and filter it to only consider
human proteins,
bioactivity type IC50,
exact measurements (relation
'='), andbinding data (assay type
'B').
[11]:
bioactivities = bioactivities_api.filter(
    target_chembl_id=chembl_id, type="IC50", relation="=", assay_type="B"
).only(
    "activity_id",
    "assay_chembl_id",
    "assay_description",
    "assay_type",
    "molecule_chembl_id",
    "type",
    "standard_units",
    "relation",
    "standard_value",
    "target_chembl_id",
    "target_organism",
)

print(f"Length and type of bioactivities object: {len(bioactivities)}, {type(bioactivities)}")
Length and type of bioactivities object: 17107, <class 'chembl_webresource_client.query_set.QuerySet'>
Each entry in our bioactivity set holds the following information:
[12]:
print(f"Length and type of first element: {len(bioactivities[0])}, {type(bioactivities[0])}")
bioactivities[0]
Length and type of first element: 13, <class 'dict'>
[12]:
{'activity_id': 32260,
 'assay_chembl_id': 'CHEMBL674637',
 'assay_description': 'Inhibitory activity towards tyrosine phosphorylation for the epidermal growth factor-receptor kinase',
 'assay_type': 'B',
 'molecule_chembl_id': 'CHEMBL68920',
 'relation': '=',
 'standard_units': 'nM',
 'standard_value': '41.0',
 'target_chembl_id': 'CHEMBL203',
 'target_organism': 'Homo sapiens',
 'type': 'IC50',
 'units': 'uM',
 'value': '0.041'}
Download bioactivity data from ChEMBL
Finally, we download the QuerySet in the form of a pandas DataFrame.
Note: This step should not take more than 2 minutes, if so try to rerun all cells starting from “Fetch bioactivity data for the target from ChEMBL” or read this message below:
Load a local version of the data (in case you encounter any problems while fetching the data)
If you experience difficulties to query the ChEMBL database, we also provide the resulting dataframe you will construct in the cell below. If you want to use the saved version, use the following code instead to obtain bioactivities_df:
# replace first line in cell below with this other line
bioactivities_df = pd.read_csv(DATA / "EGFR_bioactivities_CHEMBL27.csv.zip", index_col=0)
[13]:
bioactivities_df = pd.DataFrame.from_dict(bioactivities)
print(f"DataFrame shape: {bioactivities_df.shape}")
bioactivities_df.head()
DataFrame shape: (17107, 13)
[13]:
| activity_id | assay_chembl_id | assay_description | assay_type | molecule_chembl_id | relation | standard_units | standard_value | target_chembl_id | target_organism | type | units | value | |
|---|---|---|---|---|---|---|---|---|---|---|---|---|---|
| 0 | 32260 | CHEMBL674637 | Inhibitory activity towards tyrosine phosphory... | B | CHEMBL68920 | = | nM | 41.0 | CHEMBL203 | Homo sapiens | IC50 | uM | 0.041 |
| 1 | 32267 | CHEMBL674637 | Inhibitory activity towards tyrosine phosphory... | B | CHEMBL69960 | = | nM | 170.0 | CHEMBL203 | Homo sapiens | IC50 | uM | 0.17 |
| 2 | 32680 | CHEMBL677833 | In vitro inhibition of Epidermal growth factor... | B | CHEMBL137635 | = | nM | 9300.0 | CHEMBL203 | Homo sapiens | IC50 | uM | 9.3 |
| 3 | 32770 | CHEMBL674643 | Inhibitory concentration of EGF dependent auto... | B | CHEMBL306988 | = | nM | 500000.0 | CHEMBL203 | Homo sapiens | IC50 | uM | 500.0 |
| 4 | 32772 | CHEMBL674643 | Inhibitory concentration of EGF dependent auto... | B | CHEMBL66879 | = | nM | 3000000.0 | CHEMBL203 | Homo sapiens | IC50 | uM | 3000.0 |
Note that the first two rows describe the same bioactivity entry; we will remove such artifacts later during the deduplication step. Note also that we have columns for standard_units/units and standard_values/values; in the following, we will use the standardized columns (standardization by ChEMBL), and thus, we drop the other two columns.
If we used the units and values columns, we would need to convert all values with many different units to nM:
[14]:
bioactivities_df["units"].unique()
[14]:
array(['uM', 'nM', 'pM', 'M', "10'3 uM", "10'1 ug/ml", 'ug ml-1',
       "10'-1microM", "10'1 uM", "10'-1 ug/ml", "10'-2 ug/ml", "10'2 uM",
       "10'-3 ug/ml", "10'-2microM", '/uM', "10'-6g/ml", 'mM', 'umol/L',
       'nmol/L', "10'-10M", "10'-7M", 'nmol', '10^-8M', '10^3 uM'],
      dtype=object)
[15]:
bioactivities_df.drop(["units", "value"], axis=1, inplace=True)
bioactivities_df.head()
[15]:
| activity_id | assay_chembl_id | assay_description | assay_type | molecule_chembl_id | relation | standard_units | standard_value | target_chembl_id | target_organism | type | |
|---|---|---|---|---|---|---|---|---|---|---|---|
| 0 | 32260 | CHEMBL674637 | Inhibitory activity towards tyrosine phosphory... | B | CHEMBL68920 | = | nM | 41.0 | CHEMBL203 | Homo sapiens | IC50 |
| 1 | 32267 | CHEMBL674637 | Inhibitory activity towards tyrosine phosphory... | B | CHEMBL69960 | = | nM | 170.0 | CHEMBL203 | Homo sapiens | IC50 |
| 2 | 32680 | CHEMBL677833 | In vitro inhibition of Epidermal growth factor... | B | CHEMBL137635 | = | nM | 9300.0 | CHEMBL203 | Homo sapiens | IC50 |
| 3 | 32770 | CHEMBL674643 | Inhibitory concentration of EGF dependent auto... | B | CHEMBL306988 | = | nM | 500000.0 | CHEMBL203 | Homo sapiens | IC50 |
| 4 | 32772 | CHEMBL674643 | Inhibitory concentration of EGF dependent auto... | B | CHEMBL66879 | = | nM | 3000000.0 | CHEMBL203 | Homo sapiens | IC50 |
Preprocess and filter bioactivity data
Convert
standard_value’s datatype fromobjecttofloatDelete entries with missing values
Keep only entries with
standard_unit == nMDelete duplicate molecules
Reset
DataFrameindexRename columns
1. Convert datatype of “standard_value” from “object” to “float”
The field standard_value holds standardized (here IC50) values. In order to make these values usable in calculations later on, convert values to floats.
[16]:
bioactivities_df.dtypes
[16]:
activity_id            int64
assay_chembl_id       object
assay_description     object
assay_type            object
molecule_chembl_id    object
relation              object
standard_units        object
standard_value        object
target_chembl_id      object
target_organism       object
type                  object
dtype: object
[17]:
bioactivities_df = bioactivities_df.astype({"standard_value": "float64"})
bioactivities_df.dtypes
[17]:
activity_id             int64
assay_chembl_id        object
assay_description      object
assay_type             object
molecule_chembl_id     object
relation               object
standard_units         object
standard_value        float64
target_chembl_id       object
target_organism        object
type                   object
dtype: object
2. Delete entries with missing values
Use the parameter inplace=True to drop values in the current DataFrame directly.
[18]:
bioactivities_df.dropna(axis=0, how="any", inplace=True)
print(f"DataFrame shape: {bioactivities_df.shape}")
DataFrame shape: (17106, 11)
3. Keep only entries with “standard_unit == nM”
We only want to keep bioactivity entries in nM, thus we remove all entries with other units.
[19]:
print(f"Units in downloaded data: {bioactivities_df['standard_units'].unique()}")
print(f"Number of non-nM entries:\
    {bioactivities_df[bioactivities_df['standard_units'] != 'nM'].shape[0]}")
Units in downloaded data: ['nM' 'ug.mL-1' '/uM' '10^3 uM']
Number of non-nM entries:    71
[20]:
bioactivities_df = bioactivities_df[bioactivities_df["standard_units"] == "nM"]
print(f"Units after filtering: {bioactivities_df['standard_units'].unique()}")
Units after filtering: ['nM']
[21]:
print(f"DataFrame shape: {bioactivities_df.shape}")
DataFrame shape: (17035, 11)
4. Delete duplicate molecules
Sometimes the same molecule (molecule_chembl_id) has been tested more than once, in this case, we only keep the first one.
Note other choices could be to keep the one with the best value or a mean value of all assay results for the respective compound.
[22]:
bioactivities_df.drop_duplicates("molecule_chembl_id", keep="first", inplace=True)
print(f"DataFrame shape: {bioactivities_df.shape}")
DataFrame shape: (9996, 11)
5. Reset “DataFrame” index
Since we deleted some rows, but we want to iterate over the index later, we reset the index to be continuous.
[23]:
bioactivities_df.reset_index(drop=True, inplace=True)
bioactivities_df.head()
[23]:
| activity_id | assay_chembl_id | assay_description | assay_type | molecule_chembl_id | relation | standard_units | standard_value | target_chembl_id | target_organism | type | |
|---|---|---|---|---|---|---|---|---|---|---|---|
| 0 | 32260 | CHEMBL674637 | Inhibitory activity towards tyrosine phosphory... | B | CHEMBL68920 | = | nM | 41.0 | CHEMBL203 | Homo sapiens | IC50 |
| 1 | 32267 | CHEMBL674637 | Inhibitory activity towards tyrosine phosphory... | B | CHEMBL69960 | = | nM | 170.0 | CHEMBL203 | Homo sapiens | IC50 |
| 2 | 32680 | CHEMBL677833 | In vitro inhibition of Epidermal growth factor... | B | CHEMBL137635 | = | nM | 9300.0 | CHEMBL203 | Homo sapiens | IC50 |
| 3 | 32770 | CHEMBL674643 | Inhibitory concentration of EGF dependent auto... | B | CHEMBL306988 | = | nM | 500000.0 | CHEMBL203 | Homo sapiens | IC50 |
| 4 | 32772 | CHEMBL674643 | Inhibitory concentration of EGF dependent auto... | B | CHEMBL66879 | = | nM | 3000000.0 | CHEMBL203 | Homo sapiens | IC50 |
6. Rename columns
[24]:
bioactivities_df.rename(
    columns={"standard_value": "IC50", "standard_units": "units"}, inplace=True
)
bioactivities_df.head()
[24]:
| activity_id | assay_chembl_id | assay_description | assay_type | molecule_chembl_id | relation | units | IC50 | target_chembl_id | target_organism | type | |
|---|---|---|---|---|---|---|---|---|---|---|---|
| 0 | 32260 | CHEMBL674637 | Inhibitory activity towards tyrosine phosphory... | B | CHEMBL68920 | = | nM | 41.0 | CHEMBL203 | Homo sapiens | IC50 |
| 1 | 32267 | CHEMBL674637 | Inhibitory activity towards tyrosine phosphory... | B | CHEMBL69960 | = | nM | 170.0 | CHEMBL203 | Homo sapiens | IC50 |
| 2 | 32680 | CHEMBL677833 | In vitro inhibition of Epidermal growth factor... | B | CHEMBL137635 | = | nM | 9300.0 | CHEMBL203 | Homo sapiens | IC50 |
| 3 | 32770 | CHEMBL674643 | Inhibitory concentration of EGF dependent auto... | B | CHEMBL306988 | = | nM | 500000.0 | CHEMBL203 | Homo sapiens | IC50 |
| 4 | 32772 | CHEMBL674643 | Inhibitory concentration of EGF dependent auto... | B | CHEMBL66879 | = | nM | 3000000.0 | CHEMBL203 | Homo sapiens | IC50 |
[25]:
print(f"DataFrame shape: {bioactivities_df.shape}")
DataFrame shape: (9996, 11)
We now have a set of 5575 molecule ids with respective IC50 values for our target kinase.
Get compound data
We have a DataFrame containing all molecules tested against EGFR (with the respective measured bioactivity).
Now, we want to get the molecular structures of the molecules that are linked to respective bioactivity ChEMBL IDs.
Fetch compound data from ChEMBL
Let’s have a look at the compounds from ChEMBL which we have defined bioactivity data for: We fetch compound ChEMBL IDs and structures for the compounds linked to our filtered bioactivity data.
[26]:
compounds_provider = compounds_api.filter(
    molecule_chembl_id__in=list(bioactivities_df["molecule_chembl_id"])
).only("molecule_chembl_id", "molecule_structures")
Download compound data from ChEMBL
Again, we want to export the QuerySet object into a pandas.DataFrame. Given the data volume, this can take some time. For that reason, we will first obtain the list of records through tqdm, so we get a nice progress bar and some ETAs. We can then pass the list of compounds to the DataFrame.
[27]:
compounds = list(tqdm(compounds_provider))
100%|██████████| 9996/9996 [00:06<00:00, 1515.54it/s]
[28]:
compounds_df = pd.DataFrame.from_records(
    compounds,
)
print(f"DataFrame shape: {compounds_df.shape}")
DataFrame shape: (9996, 2)
[29]:
compounds_df.head()
[29]:
| molecule_chembl_id | molecule_structures | |
|---|---|---|
| 0 | CHEMBL6246 | {'canonical_smiles': 'O=c1oc2c(O)c(O)cc3c(=O)o... |
| 1 | CHEMBL10 | {'canonical_smiles': 'C[S+]([O-])c1ccc(-c2nc(-... |
| 2 | CHEMBL6976 | {'canonical_smiles': 'COc1cc2c(cc1OC)Nc1ncn(C)... |
| 3 | CHEMBL7002 | {'canonical_smiles': 'CC1(COc2ccc(CC3SC(=O)NC3... |
| 4 | CHEMBL414013 | {'canonical_smiles': 'COc1cc2c(cc1OC)Nc1ncnc(O... |
Preprocess and filter compound data
Remove entries with missing entries
Delete duplicate molecules (by molecule_chembl_id)
Get molecules with canonical SMILES
1. Remove entries with missing molecule structure entry
[30]:
compounds_df.dropna(axis=0, how="any", inplace=True)
print(f"DataFrame shape: {compounds_df.shape}")
DataFrame shape: (9979, 2)
2. Delete duplicate molecules
[31]:
compounds_df.drop_duplicates("molecule_chembl_id", keep="first", inplace=True)
print(f"DataFrame shape: {compounds_df.shape}")
DataFrame shape: (9979, 2)
3. Get molecules with canonical SMILES
So far, we have multiple different molecular structure representations. We only want to keep the canonical SMILES.
[32]:
compounds_df.iloc[0].molecule_structures.keys()
[32]:
dict_keys(['canonical_smiles', 'molfile', 'standard_inchi', 'standard_inchi_key'])
[33]:
canonical_smiles = []

for i, compounds in compounds_df.iterrows():
    try:
        canonical_smiles.append(compounds["molecule_structures"]["canonical_smiles"])
    except KeyError:
        canonical_smiles.append(None)

compounds_df["smiles"] = canonical_smiles
compounds_df.drop("molecule_structures", axis=1, inplace=True)
print(f"DataFrame shape: {compounds_df.shape}")
DataFrame shape: (9979, 2)
Sanity check: Remove all molecules without a canonical SMILES string.
[34]:
compounds_df.dropna(axis=0, how="any", inplace=True)
print(f"DataFrame shape: {compounds_df.shape}")
DataFrame shape: (9979, 2)
Output (bioactivity-compound) data
Summary of compound and bioactivity data
[35]:
print(f"Bioactivities filtered: {bioactivities_df.shape[0]}")
bioactivities_df.columns
Bioactivities filtered: 9996
[35]:
Index(['activity_id', 'assay_chembl_id', 'assay_description', 'assay_type',
       'molecule_chembl_id', 'relation', 'units', 'IC50', 'target_chembl_id',
       'target_organism', 'type'],
      dtype='object')
[36]:
print(f"Compounds filtered: {compounds_df.shape[0]}")
compounds_df.columns
Compounds filtered: 9979
[36]:
Index(['molecule_chembl_id', 'smiles'], dtype='object')
Merge both datasets
Merge values of interest from bioactivities_df and compounds_df in an output_df based on the compounds’ ChEMBL IDs (molecule_chembl_id), keeping the following columns:
ChEMBL IDs:
molecule_chembl_idSMILES:
smilesunits:
unitsIC50:
IC50
[37]:
# Merge DataFrames
output_df = pd.merge(
    bioactivities_df[["molecule_chembl_id", "IC50", "units"]],
    compounds_df,
    on="molecule_chembl_id",
)

# Reset row indices
output_df.reset_index(drop=True, inplace=True)

print(f"Dataset with {output_df.shape[0]} entries.")
Dataset with 9979 entries.
[38]:
output_df.dtypes
[38]:
molecule_chembl_id     object
IC50                  float64
units                  object
smiles                 object
dtype: object
[39]:
output_df.head(10)
[39]:
| molecule_chembl_id | IC50 | units | smiles | |
|---|---|---|---|---|
| 0 | CHEMBL68920 | 41.0 | nM | Cc1cc(C)c(/C=C2\C(=O)Nc3ncnc(Nc4ccc(F)c(Cl)c4)... |
| 1 | CHEMBL69960 | 170.0 | nM | Cc1cc(C(=O)N2CCOCC2)[nH]c1/C=C1\C(=O)Nc2ncnc(N... |
| 2 | CHEMBL137635 | 9300.0 | nM | CN(c1ccccc1)c1ncnc2ccc(N/N=N/Cc3ccccn3)cc12 |
| 3 | CHEMBL306988 | 500000.0 | nM | CC(=C(C#N)C#N)c1ccc(NC(=O)CCC(=O)O)cc1 |
| 4 | CHEMBL66879 | 3000000.0 | nM | O=C(O)/C=C/c1ccc(O)cc1 |
| 5 | CHEMBL77085 | 96000.0 | nM | N#CC(C#N)=Cc1cc(O)ccc1[N+](=O)[O-] |
| 6 | CHEMBL443268 | 5310.0 | nM | Cc1cc(C(=O)NCCN2CCOCC2)[nH]c1/C=C1\C(=O)N(C)c2... |
| 7 | CHEMBL76979 | 264000.0 | nM | COc1cc(/C=C(\C#N)C(=O)O)cc(OC)c1O |
| 8 | CHEMBL76589 | 125.0 | nM | N#CC(C#N)=C(N)/C(C#N)=C/c1ccc(O)cc1 |
| 9 | CHEMBL76904 | 35000.0 | nM | N#CC(C#N)=Cc1ccc(O)c(O)c1 |
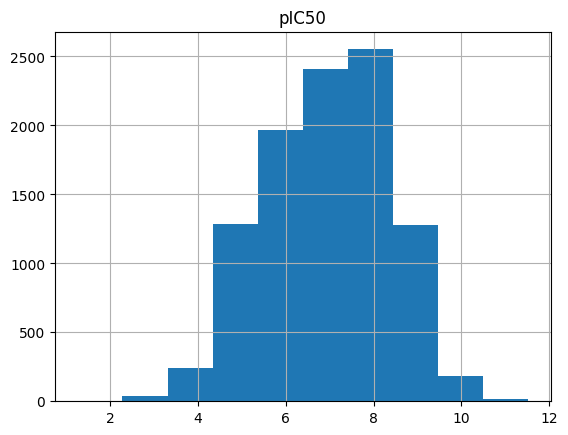
Add pIC50 values
As you can see the low IC50 values are difficult to read (values are distributed over multiple scales), which is why we convert the IC50 values to pIC50.
[40]:
def convert_ic50_to_pic50(IC50_value):
    pIC50_value = 9 - math.log10(IC50_value)
    return pIC50_value
[41]:
# Apply conversion to each row of the compounds DataFrame
output_df["pIC50"] = output_df.apply(lambda x: convert_ic50_to_pic50(x.IC50), axis=1)
[42]:
output_df.head()
[42]:
| molecule_chembl_id | IC50 | units | smiles | pIC50 | |
|---|---|---|---|---|---|
| 0 | CHEMBL68920 | 41.0 | nM | Cc1cc(C)c(/C=C2\C(=O)Nc3ncnc(Nc4ccc(F)c(Cl)c4)... | 7.387216 |
| 1 | CHEMBL69960 | 170.0 | nM | Cc1cc(C(=O)N2CCOCC2)[nH]c1/C=C1\C(=O)Nc2ncnc(N... | 6.769551 |
| 2 | CHEMBL137635 | 9300.0 | nM | CN(c1ccccc1)c1ncnc2ccc(N/N=N/Cc3ccccn3)cc12 | 5.031517 |
| 3 | CHEMBL306988 | 500000.0 | nM | CC(=C(C#N)C#N)c1ccc(NC(=O)CCC(=O)O)cc1 | 3.301030 |
| 4 | CHEMBL66879 | 3000000.0 | nM | O=C(O)/C=C/c1ccc(O)cc1 | 2.522879 |
Draw compound data
Let’s have a look at our collected data set.
First, we plot the pIC50 value distribution
[43]:
output_df.hist(column="pIC50")
[43]:
array([[<Axes: title={'center': 'pIC50'}>]], dtype=object)
In the next steps, we add a column for RDKit molecule objects to our DataFrame and look at the structures of the molecules with the highest pIC50 values.
[44]:
# Add molecule column
PandasTools.AddMoleculeColumnToFrame(output_df, smilesCol="smiles")
[45]:
# Sort molecules by pIC50
output_df.sort_values(by="pIC50", ascending=False, inplace=True)

# Reset index
output_df.reset_index(drop=True, inplace=True)
Show the three most active molecules, i.e. molecules with the highest pIC50 values.
[46]:
output_df.drop("smiles", axis=1).head(3)
[46]:
| molecule_chembl_id | IC50 | units | pIC50 | ROMol | |
|---|---|---|---|---|---|
| 0 | CHEMBL63786 | 0.003 | nM | 11.522879 | <rdkit.Chem.rdchem.Mol object at 0x1190015b0> |
| 1 | CHEMBL53711 | 0.006 | nM | 11.221849 | <rdkit.Chem.rdchem.Mol object at 0x118f74d60> |
| 2 | CHEMBL35820 | 0.006 | nM | 11.221849 | <rdkit.Chem.rdchem.Mol object at 0x118f63e60> |
[47]:
# Prepare saving the dataset: Drop the ROMol column
output_df = output_df.drop("ROMol", axis=1)
print(f"DataFrame shape: {output_df.shape}")
DataFrame shape: (9979, 5)
Freeze output data to ChEMBL 27
This is a technical step: Usually, we would continue to work with the dataset that we just created (latest dataset).
However, here on the TeachOpenCADD platform, we prefer to freeze the dataset to a certain ChEMBL releases (i.e. ChEMBL 27), so that this talktorial and other talktorials downstream in our CADD pipeline do not change in the future (helping us to maintain the talktorials).
Note: If you prefer to run this notebook on the latest dataset or if you want to use it for another target, please comment the cell below.
[48]:
# Disable this cell to unfreeze the dataset
output_df = pd.read_csv(
    DATA / "EGFR_compounds_ea055ef.csv", index_col=0, float_precision="round_trip"
)
output_df.head()
[48]:
| molecule_chembl_id | IC50 | units | smiles | pIC50 | |
|---|---|---|---|---|---|
| 0 | CHEMBL63786 | 0.003 | nM | Brc1cccc(Nc2ncnc3cc4ccccc4cc23)c1 | 11.522879 |
| 1 | CHEMBL35820 | 0.006 | nM | CCOc1cc2ncnc(Nc3cccc(Br)c3)c2cc1OCC | 11.221849 |
| 2 | CHEMBL53711 | 0.006 | nM | CN(C)c1cc2c(Nc3cccc(Br)c3)ncnc2cn1 | 11.221849 |
| 3 | CHEMBL66031 | 0.008 | nM | Brc1cccc(Nc2ncnc3cc4[nH]cnc4cc23)c1 | 11.096910 |
| 4 | CHEMBL53753 | 0.008 | nM | CNc1cc2c(Nc3cccc(Br)c3)ncnc2cn1 | 11.096910 |
[49]:
print(f"DataFrame shape: {output_df.shape}")
# NBVAL_CHECK_OUTPUT
DataFrame shape: (5568, 5)
Write output data to file
We want to use this bioactivity-compound dataset in the following talktorials, thus we save the data as csv file. Note that it is advisable to drop the molecule column (which only contains an image of the molecules) when saving the data.
[50]:
output_df.to_csv(DATA / "EGFR_compounds.csv")
output_df.head()
[50]:
| molecule_chembl_id | IC50 | units | smiles | pIC50 | |
|---|---|---|---|---|---|
| 0 | CHEMBL63786 | 0.003 | nM | Brc1cccc(Nc2ncnc3cc4ccccc4cc23)c1 | 11.522879 |
| 1 | CHEMBL35820 | 0.006 | nM | CCOc1cc2ncnc(Nc3cccc(Br)c3)c2cc1OCC | 11.221849 |
| 2 | CHEMBL53711 | 0.006 | nM | CN(C)c1cc2c(Nc3cccc(Br)c3)ncnc2cn1 | 11.221849 |
| 3 | CHEMBL66031 | 0.008 | nM | Brc1cccc(Nc2ncnc3cc4[nH]cnc4cc23)c1 | 11.096910 |
| 4 | CHEMBL53753 | 0.008 | nM | CNc1cc2c(Nc3cccc(Br)c3)ncnc2cn1 | 11.096910 |
[51]:
print(f"DataFrame shape: {output_df.shape}")
# NBVAL_CHECK_OUTPUT
DataFrame shape: (5568, 5)
Discussion
In this tutorial, we collected bioactivity data for our target of interest from the ChEMBL database. We filtered the data set in order to only contain molecules with measured IC50 bioactivity values.
Be aware that ChEMBL data originates from various sources. Compound data has been generated in different labs by different people all over the world. Therefore, we have to be cautious with the predictions we make using this data set. It is always important to consider the source of the data and consistency of data production assays when interpreting the results and determining how much confidence we have in our predictions.
In the next tutorials, we will filter our acquired data by Lipinski’s rule of five and by unwanted substructures. Another important step would be to clean the molecular data. As this is not shown in any of our talktorials (yet), we would like to refer to the Standardiser library or MolVS as useful tools for this task.
Quiz
We have downloaded in this talktorial molecules and bioactivity data from ChEMBL. What else is the ChEMBL database useful for?
What is the difference between IC50 and EC50?
What can we use the data extracted from ChEMBL for?